
Read the axis labels before deciding what a chart proves. A steep line can describe a small change on a narrow scale, and a modest slope can hide a large change on a wide one. The visual impression is a starting point; the labeled values tell you what changed.
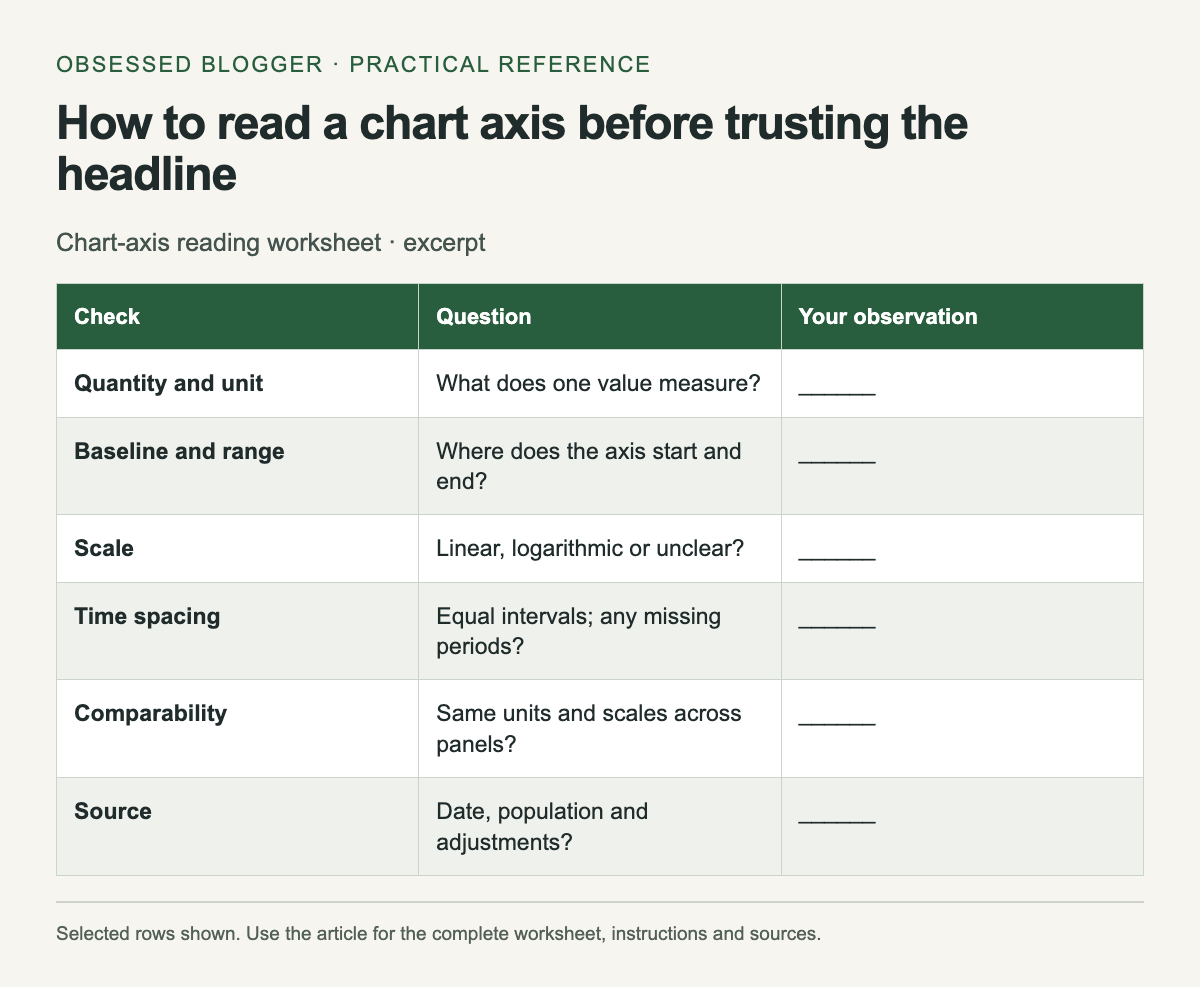
Use the worksheet below on a chart you want to share or cite. It asks for specific observations rather than a general judgment that the chart “looks misleading.” You may find that the chart is accurate but easy to misread, or that the available labels are insufficient to support the headline.
Identify the quantity and unit
Write a plain sentence describing what one plotted value means. “Monthly visitors in thousands” differs from “percentage of visitors who subscribed.” Include whether the values are counts, rates, money, an index or a cumulative total. Look for notes defining the population and period.
If the chart shows an index, find its reference point. An index of 120 with a baseline of 100 is not a count of 120 people. If it shows percentages, check the denominator before comparing groups. A missing unit is a reason to consult the source, not a reason to guess.
Inspect the baseline and range
Find the lowest and highest labeled values on the vertical axis. Then compare the plotted change numerically. In an illustrative line chart, a change from 98 to 100 is two units even if the visible axis runs only from 97 to 101 and makes the movement fill much of the panel.
A zero baseline is not mandatory for every line chart. Datawrapper's line-chart guidance discusses choosing the range and considering zero when values approach it. Read the scale in context: a focused range can reveal variation, but readers need enough labeling to understand its magnitude.
Bars encode magnitude through their length from a baseline, so inspect that starting point especially carefully. If a bar is cut off, calculate the actual values before comparing apparent lengths. A visual doubling may not represent a numerical doubling.
Check spacing on both axes
Look at the intervals between ticks. On a linear axis, equal distances represent equal numeric differences. On a logarithmic axis, equal distances represent equal multiplicative steps. If the scale is unfamiliar or not identified, consult the chart's explanation before treating a slope as a rate of change.
Read the time axis too. Equal spacing between selected years may conceal unequal gaps if the chart treats dates as categories. A gap in observations should not quietly become evidence of a smooth trend. Note missing periods and whether the chart connects across them.
Compare like with like
Two neighboring panels may use different vertical ranges. Read each scale before comparing slopes or bar heights. A small panel can also use a different unit, such as millions instead of thousands. Copying the values into a small table can make those differences easier to see.
For a chart with two vertical axes, trace each series to its own labels. The apparent intersection of two lines may depend on the chosen scales and need not mark equal values. Write the units beside each series before interpreting a crossing.
Follow the source and record the limit
Open the cited dataset or report when the conclusion matters. Check the date, revisions and whether the chart uses raw, adjusted or estimated values. A precise-looking line can still represent estimates, and a current article can reproduce an older dataset.
Finish the worksheet with one supported sentence and one uncertainty. For example, “The plotted value rises from 98 to 100; the chart does not show earlier years.” This keeps the arithmetic separate from a broader story the available chart cannot establish.
| Check | Question | Your observation |
|---|---|---|
| Quantity and unit | What does one value measure? | ______ |
| Baseline and range | Where does the axis start and end? | ______ |
| Scale | Linear, logarithmic or unclear? | ______ |
| Time spacing | Equal intervals; any missing periods? | ______ |
| Comparability | Same units and scales across panels? | ______ |
| Source | Date, population and adjustments? | ______ |
| Supported conclusion | Quote values, then state uncertainty | ______ |
0 comments:
Post a Comment