Thursday, October 15, 2026

A file naming system for projects you need to find again

Folders, archive box and portable storage drive

A useful filename tells you what the file belongs to and how it differs from nearby files. Start with a short project identifier, a meaningful description and a version or date when it helps distinguish records. Keep those parts in a consistent order so sorting produces a useful list.

Do not rename an entire archive immediately. Choose one small project, write a rule and test it with the applications and people that use those files. The worksheet below helps define that rule before you apply it more widely.
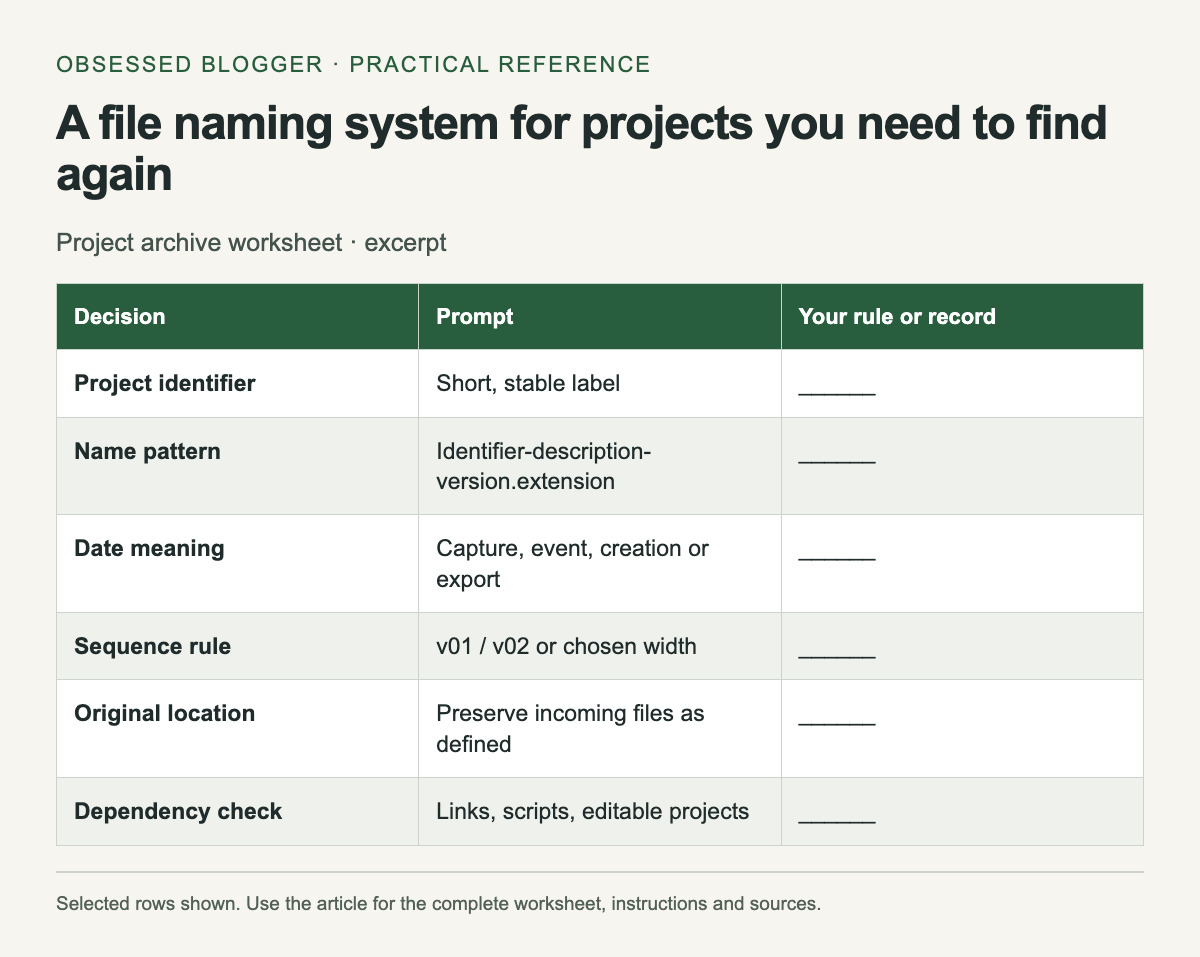
Excerpt from Project archive worksheet. The complete instructions and accessible tool follow in the article.
Selected reference rows from this guide. The complete instructions and tool, where available, remain in the article.

Pick the information that belongs in the name

Use a structure such as garden-map-v03.pdf for a revised project document or 2026-10-15-garden-notes.txt for dated notes. These are invented examples of a naming scheme. The first emphasizes a version; the second emphasizes a date that is meaningful to the record.

Define what each date means: creation, capture, event or export. If several dates matter, keep the secondary dates in an inventory or metadata instead of forcing everything into the filename. Avoid an unexplained date that another person might interpret differently.

The U.S. National Archives' naming guidance recommends consistent, unique names, sortable dates and leading zeros for numeric sequences. It also cautions against overly long or complex schemes. Adopt a compact rule that fits your own workflow rather than treating every recommendation as a universal filesystem limit.

Separate originals, working files and exports

Keep received or captured originals in a clearly labeled location. Put editable working documents and generated exports in separate folders when that distinction helps the project. An export can often be recreated from a source, while the original photograph or recording may be irreplaceable.

Write the folder meanings in a short README. For example, say whether an “originals” folder preserves incoming filenames and whether an “exports” folder contains only delivered versions. A folder name alone cannot explain exceptions, and undocumented exceptions tend to become confusing later.

Use versions that sort predictably

Choose a fixed-width sequence such as v01, v02 and v03 for a small project. If the project needs more versions, select enough digits at the beginning. Avoid mixing “final,” “final-new” and “final-really-new” with a numeric sequence.

Record which version was delivered or approved in the inventory. A filename containing “approved” can become outdated if the status changes. A small table with a status column makes that change visible without requiring every reference to the file to be renamed.

Rename with dependencies in mind

Some files are linked from documents, websites, editing projects or scripts. Renaming them can break those references. Before changing existing names, identify the files that depend on them and test a copy of the project. Use an application's own relink or rename workflow when appropriate.

For a bulk rename, save a before-and-after mapping. Check for duplicate output names before applying the changes. Do not overwrite a different file merely because two originals produce the same normalized name. Add a stable distinguishing element and document the reason.

Make the archive understandable without memory

Include an inventory listing filename, purpose, source or origin, version and status. Add any software requirement needed to reopen a working document. Keep notes factual; an empty field is better than an invented origin or an uncertain date presented as exact.

Finally, copy the archive to your chosen backup locations and verify that representative files open from a copy. Naming makes files easier to find; it does not protect the only copy from loss. When you revisit the project later, update the inventory with new exports and keep the naming rule short enough that someone else can follow it.

Project archive worksheet
DecisionPromptYour rule or record
Project identifierShort, stable label______
Name patternIdentifier-description-version.extension______
Date meaningCapture, event, creation or export______
Sequence rulev01 / v02 or chosen width______
Original locationPreserve incoming files as defined______
Dependency checkLinks, scripts, editable projects______
Inventory entryFilename / purpose / origin / status______
Backup checkCopy location and open-test result______

Sources

QR code print checklist: size the quiet zone and test the result

Phone beside a decorative code motif on a paper tag

A printed QR code needs enough physical space for its pattern and a clear margin around it. The margin is part of the design area, not spare room for a caption. Before sending a flyer or label to print, confirm the code's destination, keep its border clear and scan an actual-size proof.

There is no single print width in this article that guarantees every code will scan. The pattern, module size, printing process, surface, viewing distance and scanning device all affect the result. Use the calculator to plan dimensions, then test the actual output.

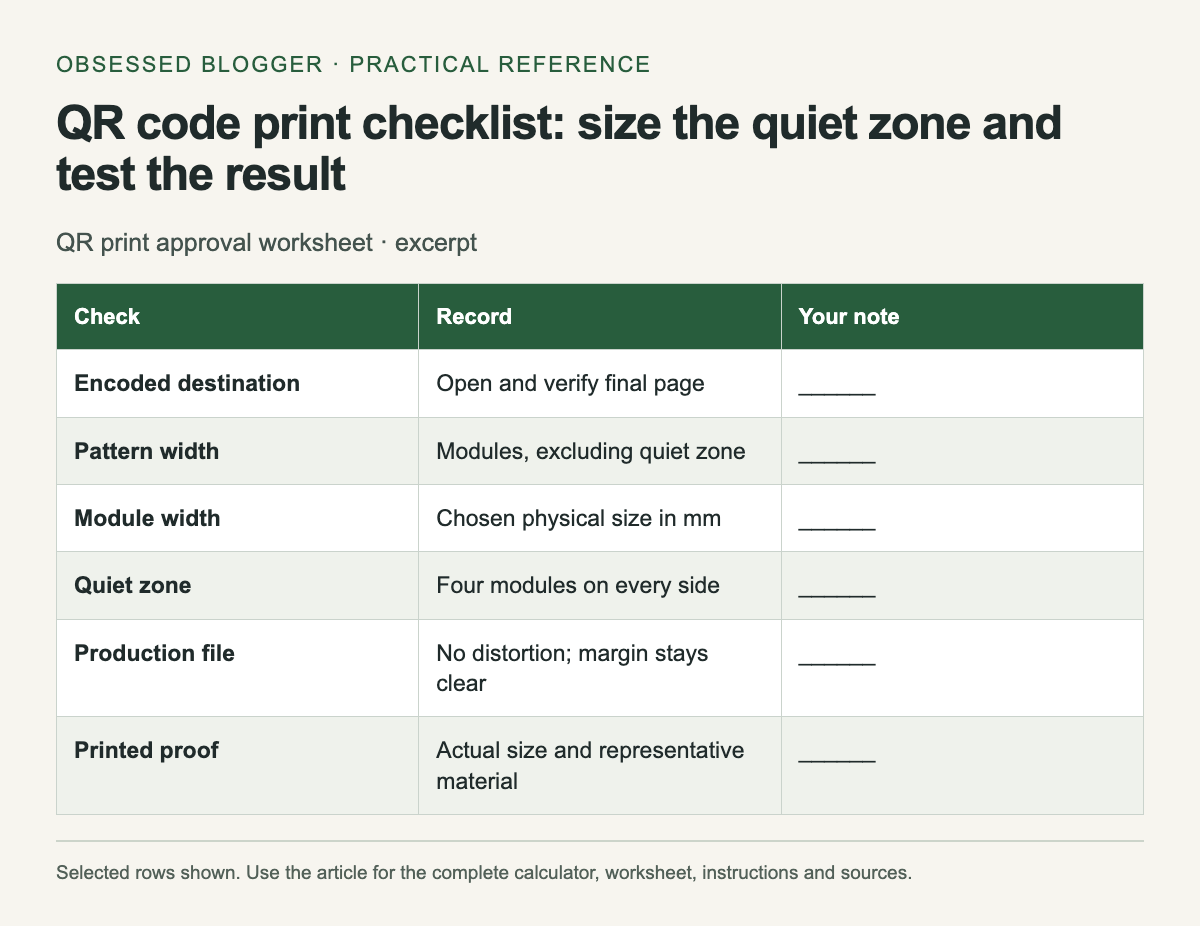
Excerpt from QR print approval worksheet. The complete instructions and accessible tool follow in the article.
Selected reference rows from this guide. The complete instructions and tool, where available, remain in the article.

Count modules, not decorative pixels

A module is one square unit in the QR pattern. Ask the generator for the symbol's module count or inspect an export that preserves the grid clearly. Do not count anti-aliased edge pixels in a screenshot as separate modules. Keep the square grid undistorted when placing the code.

DENSO WAVE's QR area guidance specifies a clear margin four modules wide on every side for a standard QR Code. The total width including that margin is the symbol width in modules plus eight, multiplied by the chosen physical module width.

Calculate a planning example

For an illustrative symbol 29 modules wide and a chosen module width of 0.5 mm, the pattern occupies 14.5 mm. Four modules of margin add 2 mm on each side, so the total reserved width is 18.5 mm. Those values demonstrate the formula; 0.5 mm is not a universal recommendation.

The calculator asks for the module count excluding the margin. If your exported image already includes a quiet zone, do not add another margin accidentally when measuring the pattern. Record whether a dimension refers to the pattern alone or the complete reserved square.

Keep the final artwork straightforward

Place the code on a clear background and keep text, borders and decorative elements outside its quiet zone. Avoid stretching the image to fit a rectangular gap. If the layout lacks room, revise the layout and test a new proof rather than squeezing the pattern into the space left over.

Use an export suitable for the print workflow and inspect it after placement. A crisp source can become blurred through scaling or conversion. Check the final PDF or print file, since that is what the printer will receive. A screenshot of the design editor is not the production file.

Verify the destination as a reader

Scan the code and inspect the complete destination before approving the proof. Confirm that it opens the intended page on a phone and that the next action works. If the code points through a redirect service, document who controls that redirect and whether continued access depends on an account or subscription.

Print a readable short destination or alternative instruction nearby when practical. This helps someone who cannot scan the code and makes the purpose clearer. Keep that text outside the quiet zone and check that it matches the encoded destination.

Test the printed result

Print at the intended size on a representative surface. Test from the likely viewing position and under the lighting the reader will encounter. Try more than one available device, and record any failure rather than counting a single successful scan as the whole test.

Check again after folding, laminating or placing the code on a curved object if those steps are part of the final use. Keep the approved proof and the source artwork together. The checklist below records what was tested so a later reprint does not quietly change size, destination or material without another check.

QR print approval worksheet
CheckRecordYour note
Encoded destinationOpen and verify final page______
Pattern widthModules, excluding quiet zone______
Module widthChosen physical size in mm______
Quiet zoneFour modules on every side______
Production fileNo distortion; margin stays clear______
Printed proofActual size and representative material______
Scanning testDevices, distance, lighting and result______

Calculate your result

Example: (29 + 8) × 0.5 mm = 18.5 mm total width.

Values stay in this page. The worked example also works without JavaScript.

Sources

How to read a chart axis before trusting the headline

Magnifying glass over graph paper with ruler and pencil

Read the axis labels before deciding what a chart proves. A steep line can describe a small change on a narrow scale, and a modest slope can hide a large change on a wide one. The visual impression is a starting point; the labeled values tell you what changed.

Use the worksheet below on a chart you want to share or cite. It asks for specific observations rather than a general judgment that the chart “looks misleading.” You may find that the chart is accurate but easy to misread, or that the available labels are insufficient to support the headline.

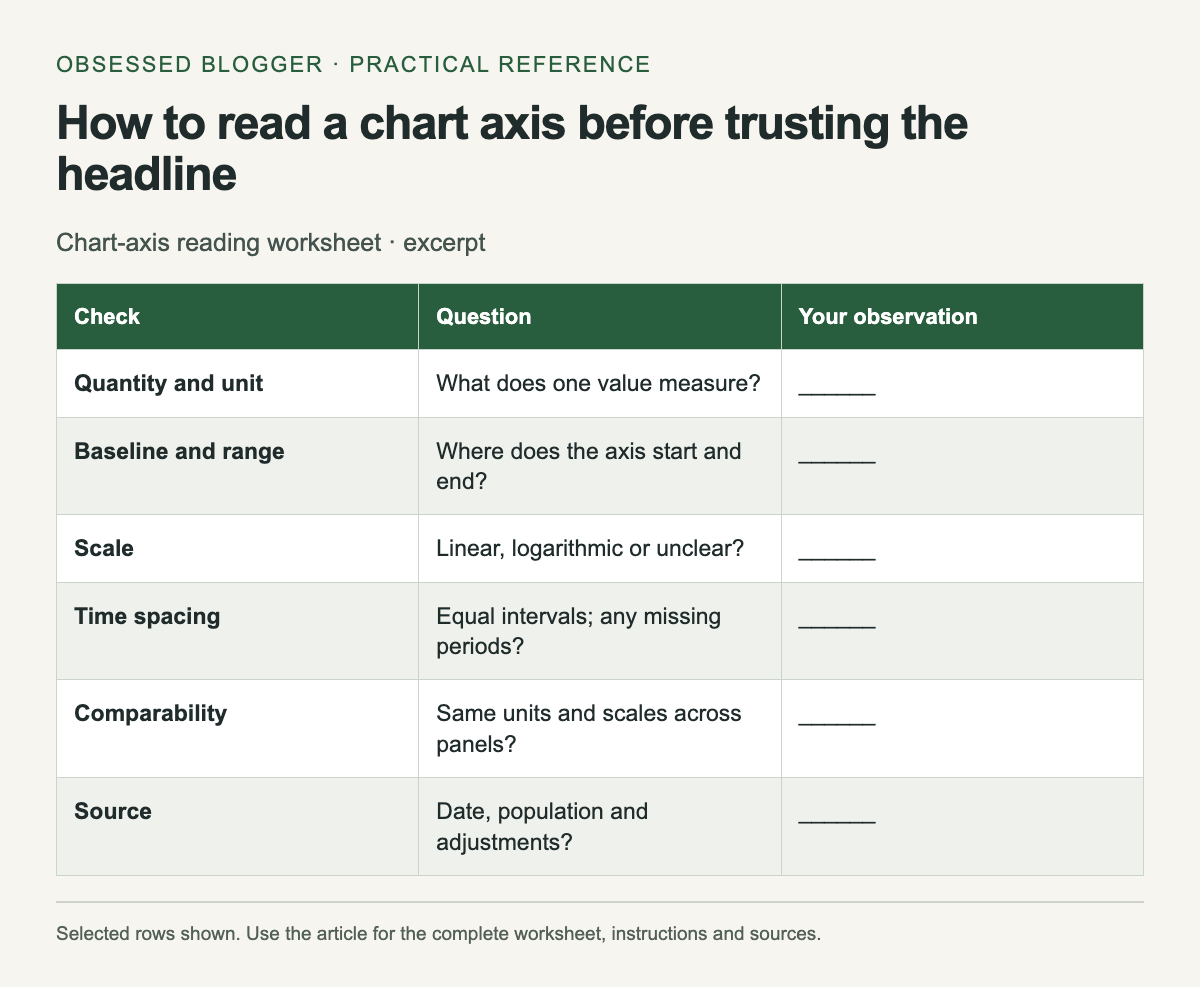
Excerpt from Chart-axis reading worksheet. The complete instructions and accessible tool follow in the article.
Selected reference rows from this guide. The complete instructions and tool, where available, remain in the article.

Identify the quantity and unit

Write a plain sentence describing what one plotted value means. “Monthly visitors in thousands” differs from “percentage of visitors who subscribed.” Include whether the values are counts, rates, money, an index or a cumulative total. Look for notes defining the population and period.

If the chart shows an index, find its reference point. An index of 120 with a baseline of 100 is not a count of 120 people. If it shows percentages, check the denominator before comparing groups. A missing unit is a reason to consult the source, not a reason to guess.

Inspect the baseline and range

Find the lowest and highest labeled values on the vertical axis. Then compare the plotted change numerically. In an illustrative line chart, a change from 98 to 100 is two units even if the visible axis runs only from 97 to 101 and makes the movement fill much of the panel.

A zero baseline is not mandatory for every line chart. Datawrapper's line-chart guidance discusses choosing the range and considering zero when values approach it. Read the scale in context: a focused range can reveal variation, but readers need enough labeling to understand its magnitude.

Bars encode magnitude through their length from a baseline, so inspect that starting point especially carefully. If a bar is cut off, calculate the actual values before comparing apparent lengths. A visual doubling may not represent a numerical doubling.

Check spacing on both axes

Look at the intervals between ticks. On a linear axis, equal distances represent equal numeric differences. On a logarithmic axis, equal distances represent equal multiplicative steps. If the scale is unfamiliar or not identified, consult the chart's explanation before treating a slope as a rate of change.

Read the time axis too. Equal spacing between selected years may conceal unequal gaps if the chart treats dates as categories. A gap in observations should not quietly become evidence of a smooth trend. Note missing periods and whether the chart connects across them.

Compare like with like

Two neighboring panels may use different vertical ranges. Read each scale before comparing slopes or bar heights. A small panel can also use a different unit, such as millions instead of thousands. Copying the values into a small table can make those differences easier to see.

For a chart with two vertical axes, trace each series to its own labels. The apparent intersection of two lines may depend on the chosen scales and need not mark equal values. Write the units beside each series before interpreting a crossing.

Follow the source and record the limit

Open the cited dataset or report when the conclusion matters. Check the date, revisions and whether the chart uses raw, adjusted or estimated values. A precise-looking line can still represent estimates, and a current article can reproduce an older dataset.

Finish the worksheet with one supported sentence and one uncertainty. For example, “The plotted value rises from 98 to 100; the chart does not show earlier years.” This keeps the arithmetic separate from a broader story the available chart cannot establish.

Chart-axis reading worksheet
CheckQuestionYour observation
Quantity and unitWhat does one value measure?______
Baseline and rangeWhere does the axis start and end?______
ScaleLinear, logarithmic or unclear?______
Time spacingEqual intervals; any missing periods?______
ComparabilitySame units and scales across panels?______
SourceDate, population and adjustments?______
Supported conclusionQuote values, then state uncertainty______

Sources

Percentage points vs percent change: calculate both correctly

Two groups of wooden counters beside a calculator

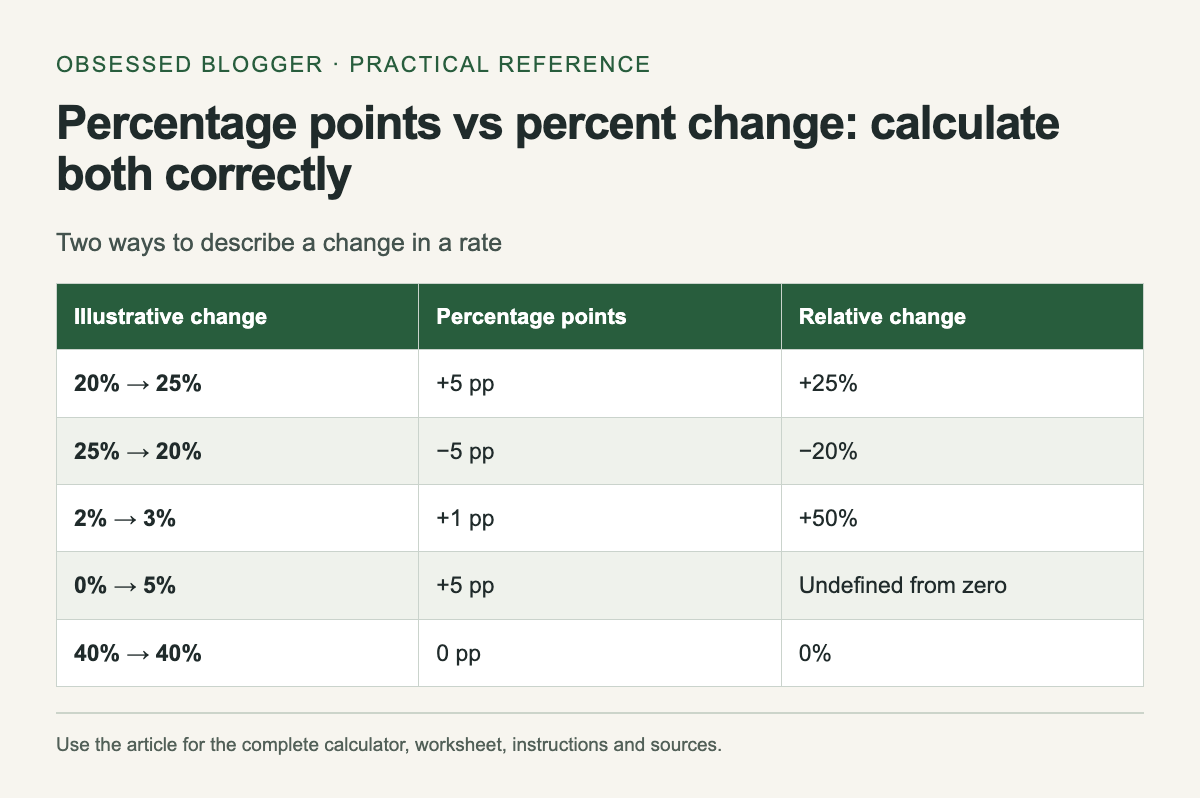
When a rate changes from 20% to 25%, it rises by 5 percentage points. Relative to the original 20%, that is a 25% increase. Both statements describe the same change, but they answer different questions. Keep the unit in the sentence so readers know which comparison you made.

Eurostat defines percentage points as the unit used to compare percentages. The calculator below reports the point difference and the relative change separately. Enter rates as ordinary percentages: type 20 for 20%, not 0.20.

Two ways to describe a change in a rate. The complete instructions and accessible tool follow in the article.
Reference graphic from this guide. The complete instructions and tool, where available, remain in the article.

Calculate the point difference first

Subtract the starting percentage from the ending percentage. For the illustrative 20% to 25% change, 25 − 20 = 5 percentage points. If the direction reverses, 20 − 25 = −5 percentage points. The magnitude is the same and the sign changes.

This direct difference is useful when describing a rate on its existing scale. A dashboard can show the starting rate, ending rate and point change side by side. That helps readers understand a small movement without asking them to reconstruct the original value from a relative percentage alone.

Calculate relative change from the starting value

Divide the difference by the starting percentage, then multiply by 100. For 20% to 25%, the calculation is (25 − 20) ÷ 20 × 100 = 25%. For the reverse change, it is (20 − 25) ÷ 25 × 100 = −20%.

The relative increase and decrease are not symmetric because the starting value changes. A 25% increase followed by a 25% decrease does not return to the original value. Starting at an illustrative 20, the sequence gives 25 and then 18.75. Use the actual starting value for each step.

Handle a zero starting rate

If the rate moves from 0% to 5%, the point increase is 5. The ordinary relative-change formula divides by zero, so it is undefined. Do not replace that result with a large invented percentage. State the original and new rates directly.

This tool accepts rates from 0% to 100%, which suits shares and proportions. It is not intended for every quantity that happens to use a percent symbol, such as a return that can exceed 100% or become negative. Use a formula appropriate to that quantity instead of forcing it into the input range.

Check the denominator behind each rate

Two rates can use different populations or periods. Before calculating, confirm what was counted and what the percentage is a share of. A change in a rate does not by itself reveal a change in the underlying count.

For example, a hypothetical 20% of 100 is 20, while 25% of 40 is 10. The rate rises while the count falls. Those example groups are deliberately different to show why a percentage headline needs its denominator. They are not observations from a real dataset.

Write a sentence readers can check

A clear format is: “The rate rose from 20% to 25%, an increase of 5 percentage points, or 25% relative to the starting rate.” You may only need the point change, but keep the start and end values nearby when space allows.

For a chart or report, also include the period, population and source. Avoid adding more decimal places than the input supports. Calculate with the underlying values and round at presentation time. The examples below provide a quick reference for checking both the direction and the choice of denominator before publishing a comparison.

Two ways to describe a change in a rate
Illustrative changePercentage pointsRelative change
20% → 25%+5 pp+25%
25% → 20%−5 pp−20%
2% → 3%+1 pp+50%
0% → 5%+5 ppUndefined from zero
40% → 40%0 pp0%

Calculate your result

Example: 20% to 25% is +5 percentage points and +25% relative change.

Values stay in this page. The worked example also works without JavaScript.

Sources

Text contrast checker: test a color pair against WCAG ratios

Contrasting paper samples beside reading glasses

Enter the text color and the solid background color as six-digit hexadecimal values, such as #333333 and #ffffff. The checker calculates their WCAG 2.x contrast ratio and compares it with the AA and AAA text thresholds. It does not inspect a page or certify that a website is accessible.

Use this tool for a known pair of opaque sRGB colors. If text sits on a photograph, gradient or translucent layer, identify the actual rendered color combination with an appropriate inspection tool. Entering the color of one layer alone can describe a different pair from the one the reader sees.

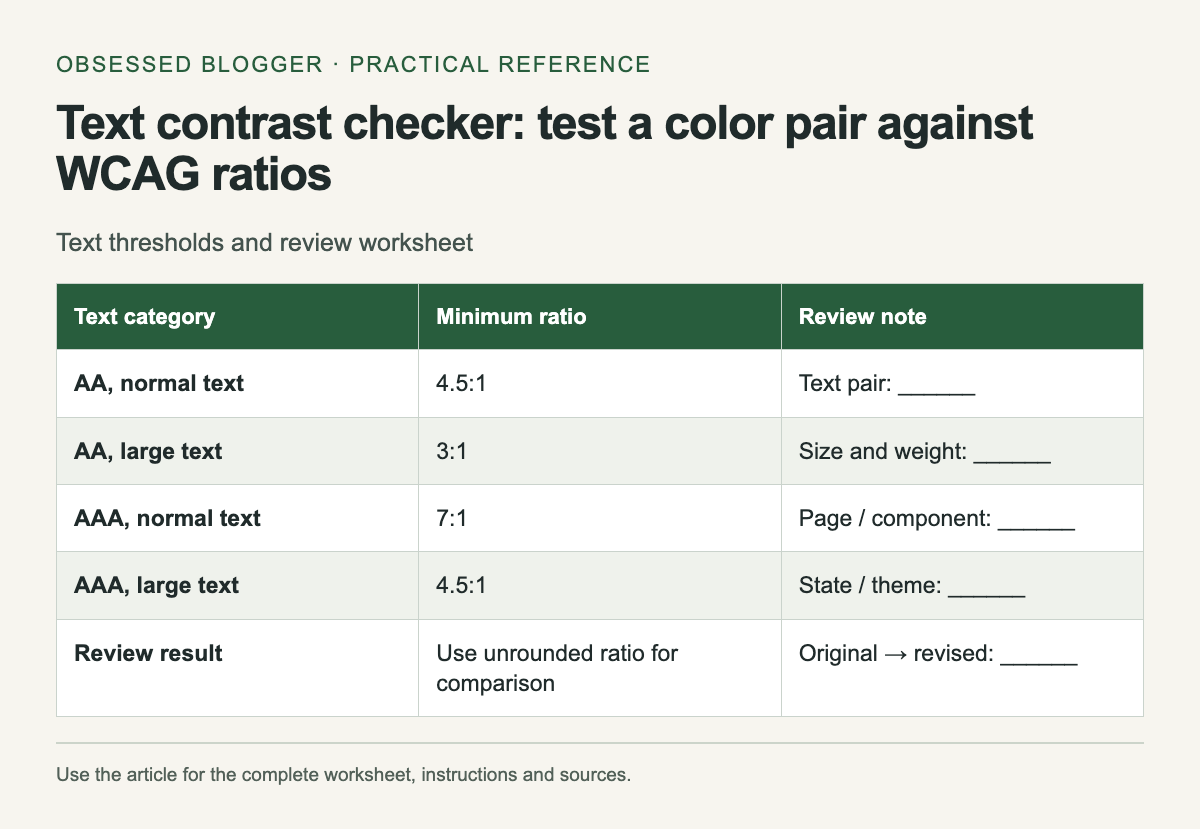
Text thresholds and review worksheet. The complete instructions and accessible tool follow in the article.
Reference graphic from this guide. The complete instructions and tool, where available, remain in the article.

Understand the result

WCAG's minimum text-contrast criterion requires at least 4.5:1 for normal text and 3:1 for large text, subject to its stated exceptions. Large text means at least 18 pt regular or 14 pt bold. The enhanced criterion uses 7:1 for normal text and 4.5:1 for large text.

The result is rounded for display, but the pass comparison uses the full calculated value. A ratio just below 4.5 must not pass because a rounded label displays 4.50. If your design is near a threshold, choose a little more separation and recheck the actual implementation.

Start with a specific text role

Write down what you are checking: article body, helper text, button label, table heading or a caption. Record the page and state. “Gray on white” is too vague to find the same combination later, especially in a product with several gray tokens and more than one white surface.

Copy the actual implemented colors where possible. A design file can be useful for planning, but a browser stylesheet may use a different token or opacity. Compare the intended value with the rendered component before closing a review item.

Make a controlled adjustment

If the pair falls below the relevant threshold, change one color and calculate again. For dark text on a light background, try a darker text value or a lighter surface. Keep the semantic role in mind: a change to a shared text token can affect many screens.

Save the original pair and the revised pair with their ratios. That makes the decision reviewable and avoids a vague instruction to “increase contrast.” After applying the change, revisit the component in context to check that neighboring text and controls remain understandable.

Check the states people encounter

A button may have different colors before and after interaction. A navigation item may sit on a different surface in a mobile menu. Build a short list of the states relevant to your component and inspect each rather than assuming one color-pair result covers them all.

The worksheet below is intentionally small enough to copy into a review note. Add rows for themes or interaction states when necessary. Keep typography beside the colors so the person reviewing the result knows which threshold you used.

Know what the calculation covers

The checker follows the relative-luminance calculation in W3C technique G18. It converts the sRGB channels before calculating luminance and then divides the lighter luminance plus 0.05 by the darker luminance plus 0.05.

A passing pair still needs readable typography and an interface that works with keyboard and assistive technology. Treat the result as evidence about this color pair, then keep the rest of the accessibility review attached to the actual page. The static threshold table remains available if JavaScript is disabled.

Text thresholds and review worksheet
Text categoryMinimum ratioReview note
AA, normal text4.5:1Text pair: ______
AA, large text3:1Size and weight: ______
AAA, normal text7:1Page / component: ______
AAA, large text4.5:1State / theme: ______
Review resultUse unrounded ratio for comparisonOriginal → revised: ______

Check two opaque sRGB colors

Example: #333333 on #ffffff is approximately 12.63:1 and meets the listed AA and AAA text thresholds.

Colors stay in this page. This checker does not evaluate transparency, gradients, images or an entire website.

Sources

Which image format should you use? A practical export worksheet

Leaf photograph beside a translucent silhouette and loupe

Choose an image format after identifying what the image contains and where it will be used. A photograph, a transparent logo and a screenshot with small text can respond differently to compression. The smallest export is useful only if it preserves the details your reader needs and the destination can display it.

Start from a separate master file. Make test exports at the same pixel dimensions so you are comparing format and compression choices fairly. Keep the original available for future edits rather than repeatedly saving over the only copy.

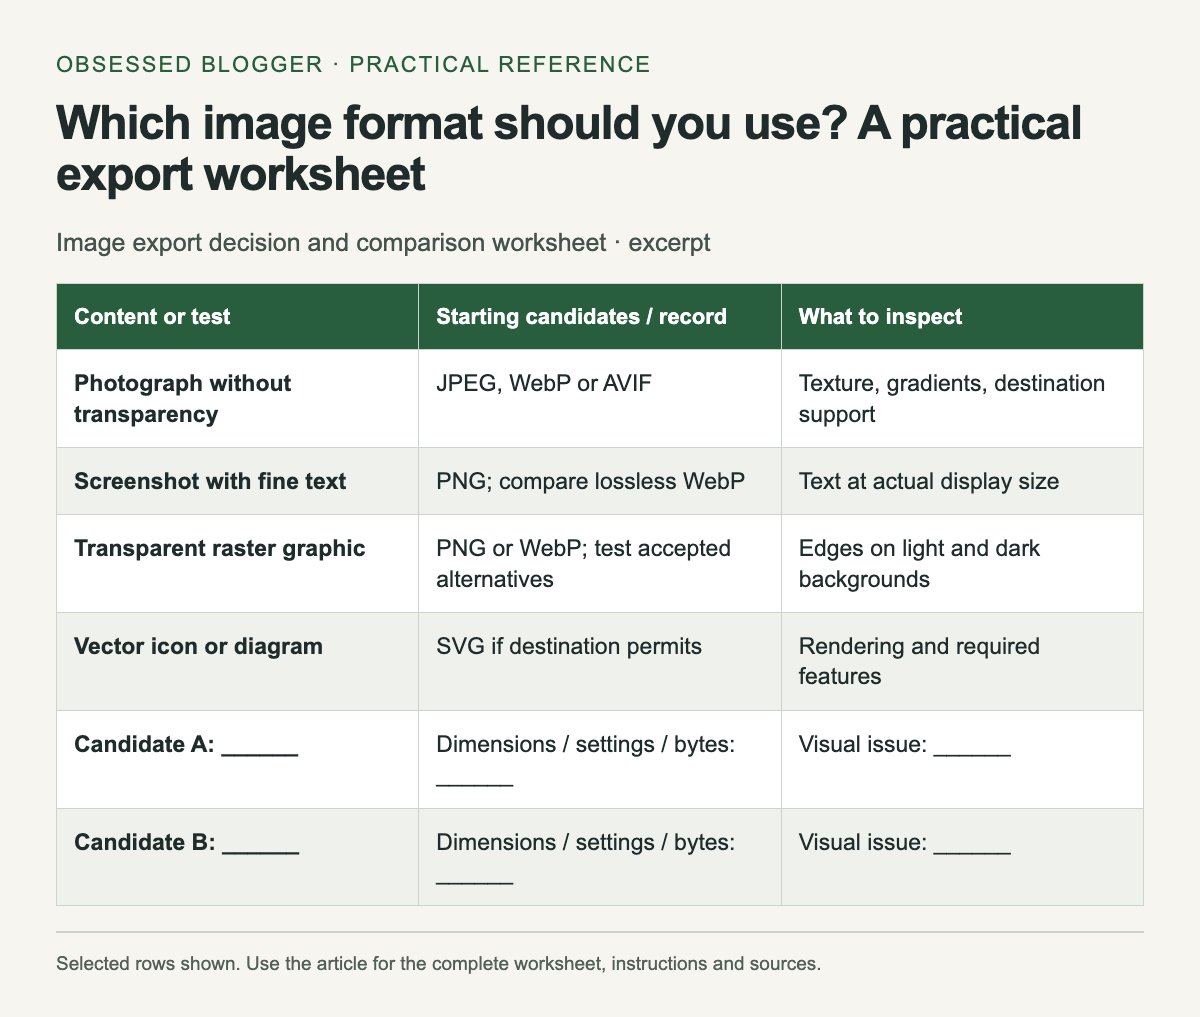
Excerpt from Image export decision and comparison worksheet. The complete instructions and accessible tool follow in the article.
Selected reference rows from this guide. The complete instructions and tool, where available, remain in the article.

Match the format to the job

MDN's image-format guide documents format capabilities and browser considerations. JPEG is a common lossy choice for photographs and does not provide an alpha channel. PNG provides lossless compression and transparency. WebP supports lossy or lossless images and transparency; AVIF is another option for compressed web imagery. SVG describes vector graphics and is useful for suitable diagrams and icons.

Those capabilities narrow the candidates; they do not select the best export setting for your particular file. The worksheet below is a starting point for a small test, not a ranking that guarantees one format always wins.

Hold dimensions constant

Decide the intended display dimensions and the resolution needed for the destination. Export each candidate at the same width and height. Comparing a 2,400-pixel JPEG with a 1,200-pixel WebP mostly tests a size difference, not just a format difference.

Record the settings as well as the file size. Quality values from different encoders are not a common measurement scale. A setting of 80 in two tools need not produce the same appearance or byte count. Reproduce the test using the same application when you want a controlled comparison.

Inspect the details that matter

For a photograph, examine edges, textured areas and smooth gradients. For a screenshot, read the smallest important text and inspect colored borders. For a transparent graphic, preview it against both light and dark backgrounds to catch unwanted edge halos.

View the image at its actual placement size as well as a close inspection scale. A difference visible only at extreme magnification may not matter for a small thumbnail, while damaged text can make a full-width tutorial image unusable. Write what failed rather than merely describing an export as “bad.”

Check the destination's rules

A website, publishing platform, email system or print service may accept different file types. Verify the specific destination's upload rules before choosing a format. An accepted upload may also be re-encoded, so inspect the delivered result rather than assuming the file you exported reaches the reader unchanged.

If you control the website, test the image in the browsers and devices your audience uses. If you do not control delivery, prioritize an accepted format and a clear result. For editable vector artwork, keep the source file even when the final destination needs a raster export.

Keep the result of the comparison

Record filename, dimensions, format, settings, bytes and one visual note in the worksheet. Choose the smallest candidate that meets your content and delivery requirements. If none does, revisit the dimensions or design instead of pushing compression until the image stops communicating its purpose.

Use a descriptive filename for the selected export and keep a brief note beside the master. The next person can then understand why a larger PNG was retained for a text-heavy diagram or why a smaller photographic export was acceptable. Repeat the test for a new kind of image; one successful comparison does not establish a universal preset.

Image export decision and comparison worksheet
Content or testStarting candidates / recordWhat to inspect
Photograph without transparencyJPEG, WebP or AVIFTexture, gradients, destination support
Screenshot with fine textPNG; compare lossless WebPText at actual display size
Transparent raster graphicPNG or WebP; test accepted alternativesEdges on light and dark backgrounds
Vector icon or diagramSVG if destination permitsRendering and required features
Candidate A: ______Dimensions / settings / bytes: ______Visual issue: ______
Candidate B: ______Dimensions / settings / bytes: ______Visual issue: ______
Chosen export: ______Destination checked: ______Reason: ______

Sources

Download time calculator: convert Mbps into a useful estimate

Router, Ethernet cable and analog stopwatch

For a download measured in decimal gigabytes and a transfer rate measured in megabits per second, ideal seconds equal GB × 8,000 ÷ Mbps. A hypothetical 2 GB file at a sustained 50 Mbps takes 320 seconds, or 5 minutes 20 seconds, before allowing for additional delays.

The word sustained matters. A plan's advertised connection rate is not a promise that every server will deliver every file at that rate. Use a measured transfer rate from the relevant connection when possible, and treat the result as a planning estimate.

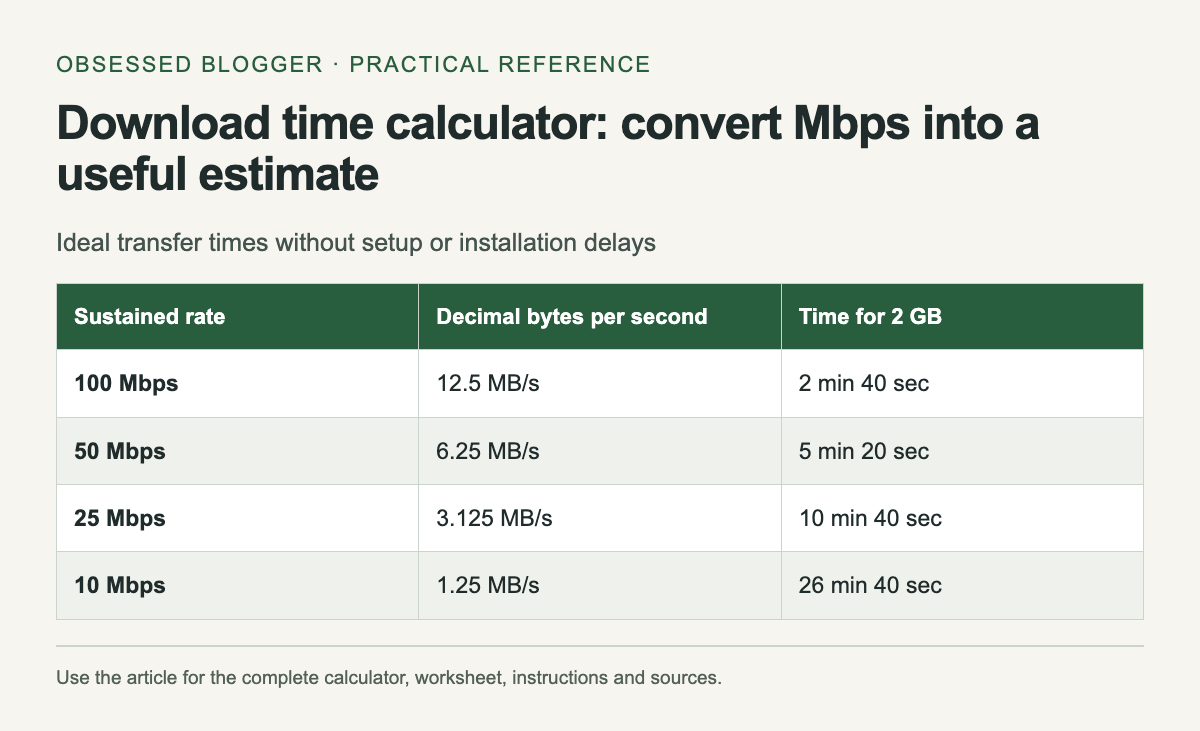
Ideal transfer times without setup or installation delays. The complete instructions and accessible tool follow in the article.
Reference graphic from this guide. The complete instructions and tool, where available, remain in the article.

Keep bits and bytes separate

NIST's unit reference defines a byte as eight bits and distinguishes decimal from binary prefixes. Mbps uses megabits per second. MB/s uses megabytes per second. Under decimal units, dividing Mbps by eight gives the equivalent MB/s before considering transfer overhead.

For example, 80 Mbps corresponds to 10 MB/s as a unit conversion. If an application reports 10 MiB/s instead, that binary unit is different. This calculator deliberately uses decimal GB and Mbps. Convert a GiB file size first rather than entering it under a GB label.

Choose a planning rate

If a previous download sustained 40 Mbps on the connection you will use, that can be a more relevant input than a higher headline plan speed. Record whether the measurement was made over Wi-Fi or a wired connection and whether other transfers were running.

The calculator also accepts a percentage of the entered rate for a slower scenario. Its default 80% is a hypothetical planning assumption, not a measured efficiency figure or an industry standard. Change it to explore the effect of a lower sustained rate; do not present that scenario as a prediction with guaranteed accuracy.

Understand the parts it cannot time

The formula measures transfer of the stated bytes at the stated rate. It does not include waiting for a server, installing software, verifying files, unzipping an archive or restarting a device. A download manager may combine several of those stages in a single progress display.

If an update says it is downloading a small patch but later writes a much larger game installation, the download size and local disk work are different quantities. Use the transfer estimate for the network stage and leave room for the remaining steps when scheduling access to the device.

Use the estimate for a concrete choice

Suppose you need a large file before leaving a reliable connection. Enter its size, calculate an optimistic time and a slower scenario, then compare both with the time available. If the slower result leaves little margin, start earlier or choose a smaller legitimate download option if the provider offers one.

For uploads, use the upload rate instead of the download rate. The arithmetic is the same, but your connection may have different rates in each direction. Do not reuse a download measurement for a backup upload unless you have verified that it applies.

Recalculate when the evidence changes

Watch the early sustained rate rather than the first brief spike. If the rate settles far below your input, update the estimate. A transfer can also change speed later, so a countdown based on the current rate will naturally move.

Keep units attached to every recorded value. “2 at 50” is not enough to reproduce a calculation; “2 decimal GB at 50 Mbps” is. The reference table uses a hypothetical 2 GB file and steady rates. It shows why halving the rate doubles the transfer time without claiming any particular internet service will maintain those speeds.

Ideal transfer times without setup or installation delays
Sustained rateDecimal bytes per secondTime for 2 GB
100 Mbps12.5 MB/s2 min 40 sec
50 Mbps6.25 MB/s5 min 20 sec
25 Mbps3.125 MB/s10 min 40 sec
10 Mbps1.25 MB/s26 min 40 sec

Calculate your result

Example: 2 GB × 8,000 ÷ 50 Mbps = 320 seconds, or 5 min 20 sec.

Values stay in this page. The worked example also works without JavaScript.

Sources